Get Forecast For:
Lawrenceville Weather

What Are The Chances of a White Christmas?

Monday, December 18th, 2006

Well, in Georgia, not very much. But, if you’re in the Northwest United States, they are very good. Below is a map showing the probability of a white Christmas based on data from 1961 through 1990:

According to the folks at the NOAA National Data Centers, who put together the graphics, the chances of a white Christmas is greatest in Savannah and Brunswick, oddly enough, with a probability of under 5%. Elsewhere in the state, the chance of snow in virtually zero. The report (PDF) says that there are five places in the US that are virtually guaranteed of having one inch of snow on Christmas day, including Marquette and St. Ste. Marie, Michigan, Hibbing and International Falls, Minnesota, and Stampede Pass, Washington. You can also find out the probability of snow on Christmas for many other cities in the report.

Sphere: Related Content

Share

How Accurate Are Weather Forecasts?

Wednesday, September 27th, 2006

You may have wondered about the accuracy of the different weather forecast services out there, since they often make different predictions about what is going to happen on a given day.

According to a recent Wall Street Journal article, someone up in Ohio wondered the same thing, and started a website called the Forecast Advisor that compares the accuracy of weather forecasts from major providers, including weather.com, the National Weather Service, and Accuweather. The comparisons are done by major city or ZIP Code. If you look at the results for Lawrenceville, for example, you’ll find that the Weather Channel has been the most accurate over the last year, followed by the National Weather Service. You can also look at previous versions of the forecast for a given day, to see how they have changed over time.

The Advisor reports the accuracy of both the National Weather Service and the NWS Digital Forecast. Although they are both produced by the Weather service, the general forecast is for a specific weather zone, for example metro Atlanta. This is the forecast you see on the Lawrenceville Forecast page, and you can see it covers everywhere from Gwinnett to south Fulton counties, which is actually a rather large area. The NWS Digital forecast, on the other hand, tries to produce a forecast for a specific latitude and longitude, accurate to within a several mile radius. That’s the forecast used for the Lawrenceville Pinpoint Forecast, as well as the quick forecast on the home page. Because it covers a smaller area, it tends to be more accurate.

Sphere: Related Content

Share

Weather Service Introduces New Climate Prediction Tools

Wednesday, July 26th, 2006

The National Weather Service has developed some new web-based tools to help people understand and use their three month seasonal forecasts. In the past, the long range forecasts, made over three month rolling periods were distributed in the form of maps showing areas where the temperature was expected to be above or below normal.

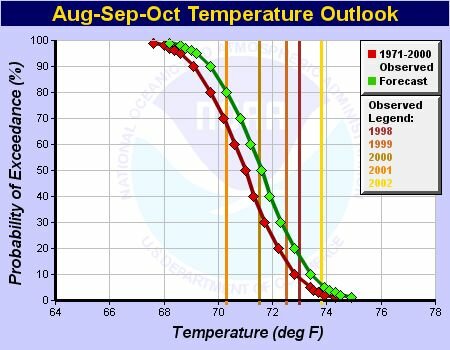
Now, they are providing a series of graphs and charts at the local level, which in North Georgia includes Atlanta Hartsfield, Athens, Cartersville, Rome, Newnan, and Gainesville. For example, the chart below shows the probability that the actual temperature will exceed a given temperature.

So, you can see that there is an almost 100% chance that the average temperature will be greater than 68 degrees, while almost a 0% chance that the average will be greater than 74. Because the green forecast line is to the right of the red actual line, overall, there is a greater chance of warmer than normal temperatures from August through October. You can look at the latest 3 month outlook for Atlanta here.

In addition to the Probability of Exceedence graph shown above, they have a number of pie charts and tables to illustrate the data in other ways, including temperature ranges and the chances of temperatures being above or below normal.

Sphere: Related Content

Share

When Will We See The First Freeze?

Tuesday, October 25th, 2005

Atlanta’s weather experienced a sudden change over the weekend, as temperatures dropped about 20 degrees compared to what we saw earlier in the month. The change was brought on by the first major upper level low pressure system driving cold air into the area.

The coldest of the temperatures for this round will be tonight and Wednesday, with temperatures in the upper 30s. Temps should stay below normal through the end of the first week of November, when we may see daytime temperatures above 70 degrees again.

The warmer than normal temperatures during the first part of the month, combined with a dry September have played havoc with the normal fall color and leaf peeping season. Last weekend I drove to Cincinnati and back. While Kentucky was beautiful, Tennessee and North Carolina, even in the Smokies, was still largely green, although clearly the leaves on the trees were thinner than they would be in midsummer. With little to no rain forecast for the next two weeks, we may see a less spectacular than normal fall season.

In case you’re wondering, the first freeze in the Atlanta area is normally around November 10th. Since 1948, the earliest freeze recorded at Hartsfield Airport was on October 18th, in 1948, and the latest freeze was on December 18th, in 1998. Of course, conditions at Hartsfield can vary a lot from what we see in Gwinnett. Last year, I recorded a freeze on November 14th, although Hartsfield didn’t see temperatures that low until December 14th.

What’s your guess for when we’ll see the first freeze of the year?

Sphere: Related Content

Share

Why Won’t It Be As Cold As Earlier Forecasts Predicted?

Saturday, January 29th, 2005

One of this blog’s readers commented on this post about how the temperatures would not be as cold this weekend as predicted previously, asking:

Any idea why the Canadian air is stalling out? Is that usually because of high pressure here?

I guess that there are two parts to the answer: first, what causes temperature changes?, and second, why do forecasts change from one prediction to another?

Ultimately, much of the weather in the United States is controlled by the flow of air in the upper atmosphere. This upper air flow is called the jet stream, and there are typically two jetstreams in North America: a polar jetstream that runs across the northern half of the hemisphere, and a subtropical jet stream that runs across the southern half of the hemisphere.

The interaction of the two streams determines much of the weather we get in the United States. If the polar jetstream moves to the south, it gets colder and dryer. If the subtropical jetstream moves north, we have warmer and wetter conditions. These intersections help create the warm fronts and cold fronts that indicate changes in the weather.

For more information on how the jetstreams work, and to see current and predicted jetstream positions, check out the Jetstream Analysis Page provided by San Francisco State University in California.

The second part of your question deals with why it isn’t expected to be as cold as was originally predicted in this entry. The reason why we are not getting well below normal temperatures this weekend is because the polar jetstream did not move as far south as originally estimated.

The extremely cold temperature predictions were based on a long range forecast created by the National Weather Service. The NWS uses several different computer models to estimate future weather patterns, and at the time I posted the forecast, the models they used indicated that the polar jet stream would move further south than what is believed now.

Long range forecasting is a tricky business. Computer models take current conditions, look into the past to find similar circumstances, and predict the weather based on what happened after similar weather in the past. Just like the “any given Sunday” type odds in Football, actual results may vary.

Sphere: Related Content

Share