Get Forecast For:
Lawrenceville Weather

How Long Could the Southeast Drought Last?

Wednesday, November 14th, 2007

The southeast is currently in the throes of what is being called a 100 year drought. Most climatologists say that the drought began back in the spring of 2006, and continues through today. While I’d love to be able to say that the drought will be over soon, taking a look at history and climate cycles, we could be in a situation where drought will be the ‘new normal’ for the next 20 years.

You are probably familiar with El Nino and La Nina, the complementary patterns of sea surface temperatures in the Pacific Ocean. In El Nino years, when sea surface temperatures are warmer, the southeast tends to get more rain, while in La Nina years, including the one we are in now, the southeast tends to be warmer and drier. El Nino and La Nina tend to be short term patterns, lasting a year or so. Frequently, sea surface temperatures are neutral, with neither condition occurring.

There are also longer term ocean temperature trends, ones that my last from 30 to 70 years. One trend is the Atlantic Multidecadal Oscillation, or AMO, that reflects ocean temperatures in the Atlantic. Another is the Pacific Decadal Oscillation, or PDO, that represents Pacific Ocean temperatures. These two long term trends tend to have some effect on the amount of rainfall seen in different parts of the country, including the Southeast.

(more…)

Sphere: Related Content

Share

Models and Teleconnections Again Threaten Cold Weather

Monday, January 30th, 2006

As January prepares to end, people all over the country are wondering, “Where is Winter?” Temperatures continue to be much warmer than normal, and despite several model predictions and teleconnections, not much has changed in the weather since the beginning of the month. We continue to see a largely zonal air flow from the Pacific, combined with a heat ridge over the Atlantic that is keeping much of the East in a springlike pattern.

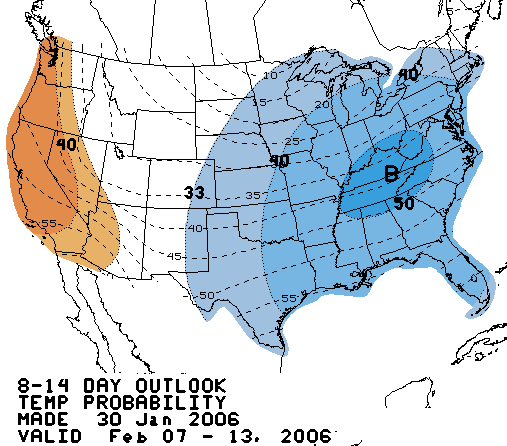
If you believe the models, all of this is going to come to an end beginning in the middle of next week. Here is the National Weather Service 8 to 14 day outlook for the period between February 7th and 13th:

The predicted pattern of colder than normal temperatures in the east, and warmer than normal temperatures in the west (plus warm in Alaska, which isn’t on this map), match the typical negative Arctic Oscillation and North Atlantic Oscillation teleconnection cycles. However, both these signals seem to have bottomed out, and are rising again. The forecast models also haven’t been particularly reliable this winter either.

So, we’ll have to wait and see. Expect warm weather this week, with temperatures in the low 60s, with a chance of a storm on Thursday. As we’ve seen this season, temps will be a little lower following each storm, but will rebound quickly. For next week, if the forecasts verify, we’ll see highs in the upper 40s, which is about 5 degrees colder than normal for the second week in February.

I had a chance to get down to the WeatherFest at the World Congress Center on Sunday, and met several prominent meteorologists, including Paul Kocin, the winter weather expert at the Weather Channel and Max Mayfield, Director of the National Hurricane Center, who assured me that last year’s hurricanes had nothing to do with global warming.

I also had a chance to speak to Elliot Abrams, Chief Forecaster for Accuweather. I listened as he explained how a change in the polar vortex at 10 MB of pressure should cause the polar jetstream to move south. Such a change has occurred within the last week or so, but as Elliot was the first to admit, he’ll be the first to chuck the theory if it doesn’t get cold soon.

Sphere: Related Content

Share

Signs Point To a Colder February

Wednesday, January 18th, 2006

A month ago, I posted on the relationship of the Arctic Oscillation teleconnection to the colder weather we experienced in December. Essentially, when this indicator goes negative, you can expect colder winter weather in the Southeast, while when it’s positive, the weather is more likely to be warm and dry.

There is another teleconnection that can shed some light on likely winter weather patterns, the North Atlantic Oscillation. The NAO, as it’s called, measures the differences in unusual air pressure in the northern and southern Atlantic. When the index is positive, the eastern United States tends to have milder and wetter winter weather, while when the index is negative, the east coast tends to be colder, with more snow.

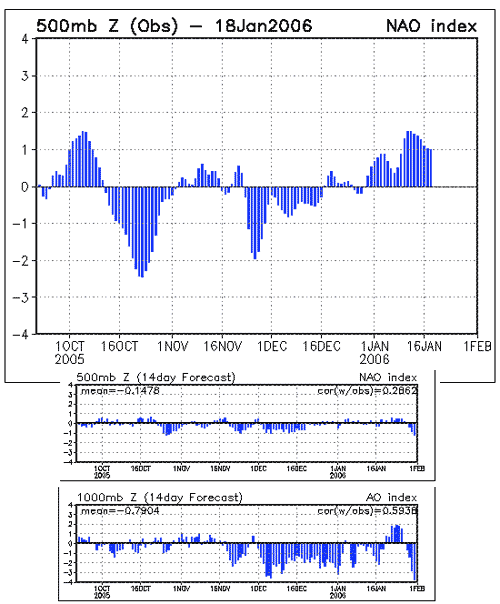
The graph below shows recent measurements of the NAO, along with the forecast for the next two weeks:

As you can see, the NAO has been in a positive phase since late December, corresponding to the milder weather we’ve seen so far in January. However, since the second week of the month, its effects have been getting weaker, and if you look at the second graph, which shows the 14 day predicted position, it should go into a negative phase soon.

The third chart shows the Arctic Oscillation prediction. After being in a positive phase in early January, it too is predicted to go negative.

While not as accurate as your typical three day forecast, these two teleconnections provide some indication that we may very well see more normal winter weather for February. The CPC’s 6 to 19 and 8 to 14 day outlooks through the first of the month still call for warmer and wetter conditions than normal through the first of the month, although the warm area shrinks in the longer-range forecast.

The weather service will issue its long range forecast for February tomorrow. It will be interesting to see what they predict.

Sphere: Related Content

Share

Winter Weather Shown in Teleconnections

Monday, December 19th, 2005

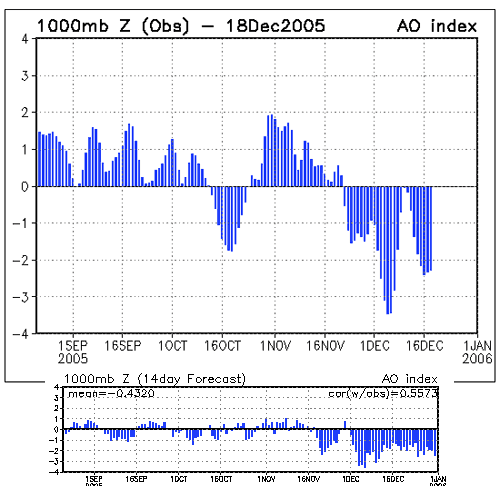
The Weather Service’s Climate Prediction Center recently changed its home page, which normally shows a map of the US highlighting areas of drought, to display the recent history of the Arctic Oscillation. The chart is reproduced below.

The Arctic Oscillation tracks the relationship between air pressure in the Arctic and the middle latitudes (around 45 degrees North). Useful for measuring and predicting winter weather, when it’s in a positive phase, high pressure in the south and low pressure in the north tend to bring warm, dry weather to the central and southern US, while when it’s in a negative phase, the jet stream moves south, and we get colder, wetter weather.

The Arctic Oscillation is one of several relationships between pressures or temperatures called Teleconnections that can be useful in measuring and predicting weather.

As you can see, the AO has been in its negative phase since late November, just as the weather started to turn colder than normal here in Georgia. So far in December, we’re running about 5.4 degrees cooler than normal, on average, with only two days of above average temperatures. The normal temperatures for the beginning of the month are a high of 58 and a low of 39, and at the end of the month, a high of 51 and a low of 32. The normal average temperature is 44.5 for the entire month, to date, the average is 40.5 degrees.

The news isn’t good for people that enjoy moderate temperatures. Below the large historical chart of the AO is the most recent 14 day prediction for future activity, and as you can see, it’s predicted to stay negative for the period.

The Weather Service released its monthly long range forecast for January, which calls for equal chances of above or below normal temperature and precipitation in Georgia, except for South Georgia, which is predicted to have a 33% greater than normal chance of dry weather. The medium range forecast through January 1st calls for colder than normal temperatures through the period, with precipitation tending from wetter than normal the early part of Christmas week, and dryer than normal New Year’s weekend.

Sphere: Related Content

Share

March 9th: Temps 15 Degrees Below Normal

Wednesday, March 9th, 2005

Today’s high of 48 degrees is 15 degrees below the normal high of 63, and this morning’s low of 29 was 13 degrees below the normal low of 42. If you’re like me, you’re probably tired of seeing January temperatures in March.

The eastern half of the country remains trapped in a weather pattern that I discussed in this post, where a warm weather in the western half of the country and a ridge over the north Atlantic contribute to cold Arctic air being pushed into the eastern half of the country.

The good news is that the Pacific North American Pattern, which is responsible for the ridge in the west, is getting ready to transition from being extremely high to dropping below normal, as seen in the following graph from the National Weather Service:


The graph shows that we had a negative PNA in the late part of December and the first part of January, corresponding to the extremely warm temperatures at the beginning of the year. A more modest drop in early February matched the slightly warmer than normal temperatures at that time. The extremely high values since March 1st match our recent January like temperatures.

If the predicted changes hold true, the arctic air intrusion will move further to the west, causing colder weather in the Dakotas, which have been unseasonably mild for this time of year, and allow the weather in the Southeast to be influenced more by the Gulf of Mexico, meaning warmer weather.

Still, I don’t see a forecast of above 70 degrees until at least March 20th, the first official day of Spring. We continue to be threatened by fast-moving weather patterns that could bring a chance of snow. It looks like we dodged the bullet for tonight, but additional short wave activity will return on Friday, and again possibly on Saturday. I’m more worried about a potential storm around St. Patrick’s day that will probably bring additional snow to the Northeast, but could affect us.

Do you realize that New York City is getting ready to experience its fourth year in a row with over 40 inches of snow — a modern record? Part of the reason for the recent concerns about high gasoline prices is due to the extremely cold weather, not only here in the United States, but in Europe as well. So much for global warming.

Sphere: Related Content

Share